Support and resistance are key concepts in price action trading that refer to price levels where the market tends to pause or reverse direction.
Support is a level where the price tends to bounce higher. This is because there are more buyers than sellers at that price level, and the demand for the asset is greater than the supply. As a result, the price is more likely to rise.
Resistance is a level where the price tends to stall or reverse. This is because there are more sellers than buyers at that price level, and the supply of the asset is greater than the demand. As a result, the price is more likely to fall.
Traders can use support and resistance levels to help them identify potential entry and exit points for trades, as well as to set stop-loss orders to manage risk. These levels can be identified by looking for areas on the chart where the price has previously found support or resistance. They can also be identified using technical analysis tools such as trendlines and horizontal levels.
It is important to note that support and resistance levels are not exact and can be broken. When the price breaks through a key level of support or resistance, it can signal a change in market sentiment and may be used by traders as an entry or exit point for a trade. However, false breaks can also occur, where the price appears to break through a key level but then quickly reverses direction. Traders need to confirm breakouts before entering trades.
Table of Contents
More About Support
Support is a level where the price of an asset tends to bounce higher. This is because there are more buyers than sellers at that price level, and the demand for the asset is greater than the supply. As a result, the price is more likely to rise.
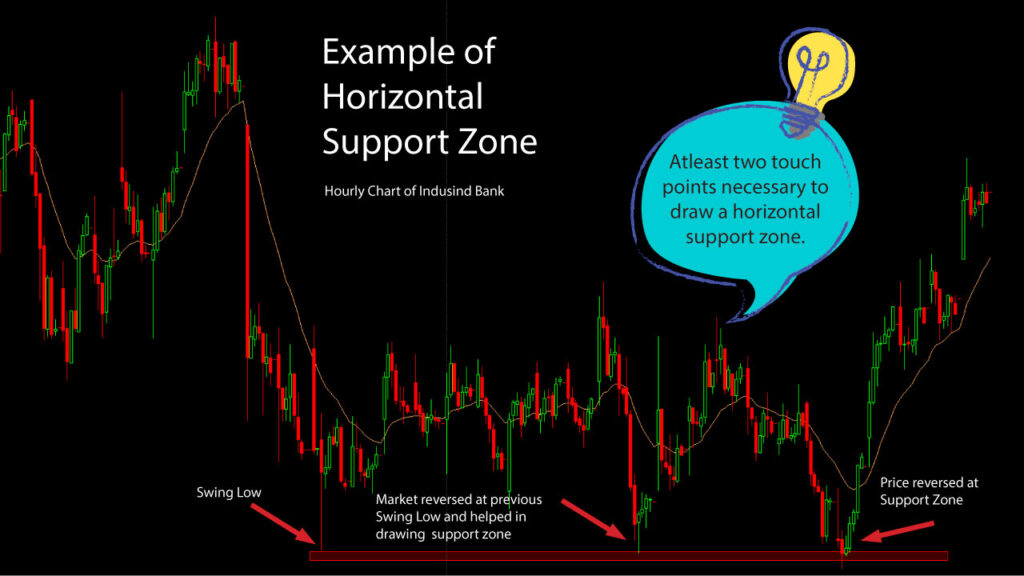
Support levels can be identified by looking for areas on the chart where the price has previously found support. For example, if the price has bounced off a particular price level several times in the past, that level may be considered a support level.
Support levels can be used by traders in many ways:
- As a potential entry point for a long (buy) position: If the price is approaching a support level and there are signs of bullish sentiment (such as a bullish candlestick pattern), traders may consider entering a long position in the expectation that the price will bounce higher off the support level.
- As a place to set a stop-loss order: A stop-loss order is an order to sell an asset if it reaches a certain price. By setting a stop-loss order at a support level, traders can limit their potential losses if the price moves against them.
- As a target for taking profits: If the price breaks through a key support level, traders may consider taking profits on their long positions as the price may be more likely to continue falling.
It is important to note that support levels are not exact and can be broken. When the price breaks through a key level of support, it can signal a change in market sentiment and may be used by traders as an exit point for a trade. However, false breaks can also occur, where the price appears to break through a key level but then quickly reverses direction. Traders need to confirm breakouts before entering or exiting trades.
How to Plot Support Levels?
There are several ways to plot support levels or zones on a chart:
- Identify previous swing lows: A swing low is a low point on the chart that is formed by the price moving lower and then reversing direction. By connecting two or more swing lows with a trendline, traders can identify a potential support zone.
- Use horizontal levels: Horizontal levels are horizontal lines drawn at specific price levels on the chart. These levels can be used to mark key areas of support or resistance.
- Use technical indicators: Some technical indicators, such as the Moving Average, can be used to identify potential support levels.
- Use Fibonacci retracement levels: Fibonacci retracement levels are horizontal lines drawn on the chart at specific levels based on the Fibonacci sequence. These levels can be used to identify potential areas of support or resistance.


What is Resistance?
A resistance level is a price point at which it is expected that there will be a decrease in demand for an asset or security, leading to a decrease in price. This is often because there are a large number of traders who have established positions in the asset or security at that price point, and are looking to sell if the price rises above their purchase price. As a result, the resistance level acts as a barrier that makes it difficult for the price to rise above it.
Resistance levels can be identified on a chart by examining the price history of an asset or security and identifying price points at which the price has consistently struggled to rise above. These levels can then be used by traders as a reference point for placing orders or establishing positions.
It’s important to note that resistance levels are not absolute and can be broken if there is a significant shift in market conditions or if there is a sudden increase in demand for the asset or security. In this case, the resistance level may be “broken” and the price may continue to rise.
What are the uses resistance level?
There are several ways that traders and investors can use resistance levels in their analysis and decision-making:
- As a reference point for placing orders: Resistance levels can be used to help traders determine where to place orders to buy or sell an asset. For example, a trader might place a sell order just above a resistance level, in the expectation that the price will struggle to rise above it and will eventually fall.
- As a target for taking profits: If a trader has already established a long position in an asset, they may use a resistance level as a target for taking profits. For example, if the price approaches a resistance level, the trader might sell their position in the expectation that the price will struggle to rise further.
- As a signal for entering or exiting a position: Some traders may use resistance levels as a signal for entering or exiting a position. For example, if the price breaks through a resistance level, it may be seen as a bullish sign and a signal to enter a long position. Conversely, if the price struggles to rise above a resistance level and starts to fall, it may be seen as a bearish sign and a signal to exit a long position or to enter a short position.
How to plot resistance level on chart?
Plotting resistance level is just the opposite of support level. To plot a resistance level on a chart, follow these simple steps:
- Identify a time period to analyze: To plot a resistance level, you’ll need to examine the price history of an asset or security over a specific time period. This could be a few days, weeks, months, or even years, depending on your objectives and the level of detail you want to see.
- Choose a chart type: There are several types of charts that you can use to plot a resistance level, including line charts, bar charts, and candlestick charts. Each type of chart has its own benefits and drawbacks, and the one you choose will depend on your personal preferences and the information you want to see.
- Identify the resistance levels: As you examine the chart, look for swing highs at which the price has consistently struggled to rise above. These may be areas where there are a large number of traders who have established positions in the asset or security and are looking to sell if the price rises above their purchase price.
- Mark the resistance levels: Once you’ve identified the swing highs, you can connect them on the chart by drawing horizontal lines.


Hope you have a general idea on support and resistance now. On the next post we will discuss more about support and resistance.